Every month, contractors get reports that say local SEO is "working": impressions up, rankings up, calls up. And every month, some of those contractors stare at their bank account and wonder what "working" is supposed to feel like. The gap between the report and the revenue is the attribution problem, and for home-service trades it is a specific one. A $189 drain cleaning and a $14,000 sewer line replacement are both "a call." An emergency dispatch and a three-week roofing estimate cycle are both "a lead." Generic attribution formulas flatten all of that into one number and call it ROI. This guide builds the contractor's version instead.
The method is a worksheet, not a dashboard. Dashboards impress; worksheets answer. You will trace calls and forms to booked jobs, booked jobs to revenue, and revenue against your true cost, with the trade adjustments that make the numbers honest: emergency vs. planned work, repeat revenue, and the AI referrals that are currently invisible in every analytics setup.
On This Page
The Honest Formula
Attribution starts with one equation and gets honest from there:
Attributed revenue = (calls + forms) × qualification rate × close rate × average job value.
Then the ROI question: (attributed revenue − total monthly cost) ÷ total monthly cost. If that number is positive and growing, your SEO is paying for itself. Total cost means everything: the retainer, the tools, and your own hours valued at your billable rate. Contractors routinely forget the third one, which makes DIY look free and agencies look expensive. Both errors cost you.
The "leads" side of the formula needs clean definitions. Google's Business Profile performance documentation defines what a call, a booking, or a website click actually means in your dashboard, and Search Console's Performance report shows which queries and pages produced the demand. Those are your raw materials. The rest of this guide turns them into revenue.
Booked Jobs, Not Calls
The single biggest lie in local SEO reporting is the call count. A call is a chance at revenue; a booked job is revenue. Call counts include wrong numbers, price shoppers who were never going to hire you, and jobs forty miles outside your service area. Agencies lead with call counts because call counts always look good.
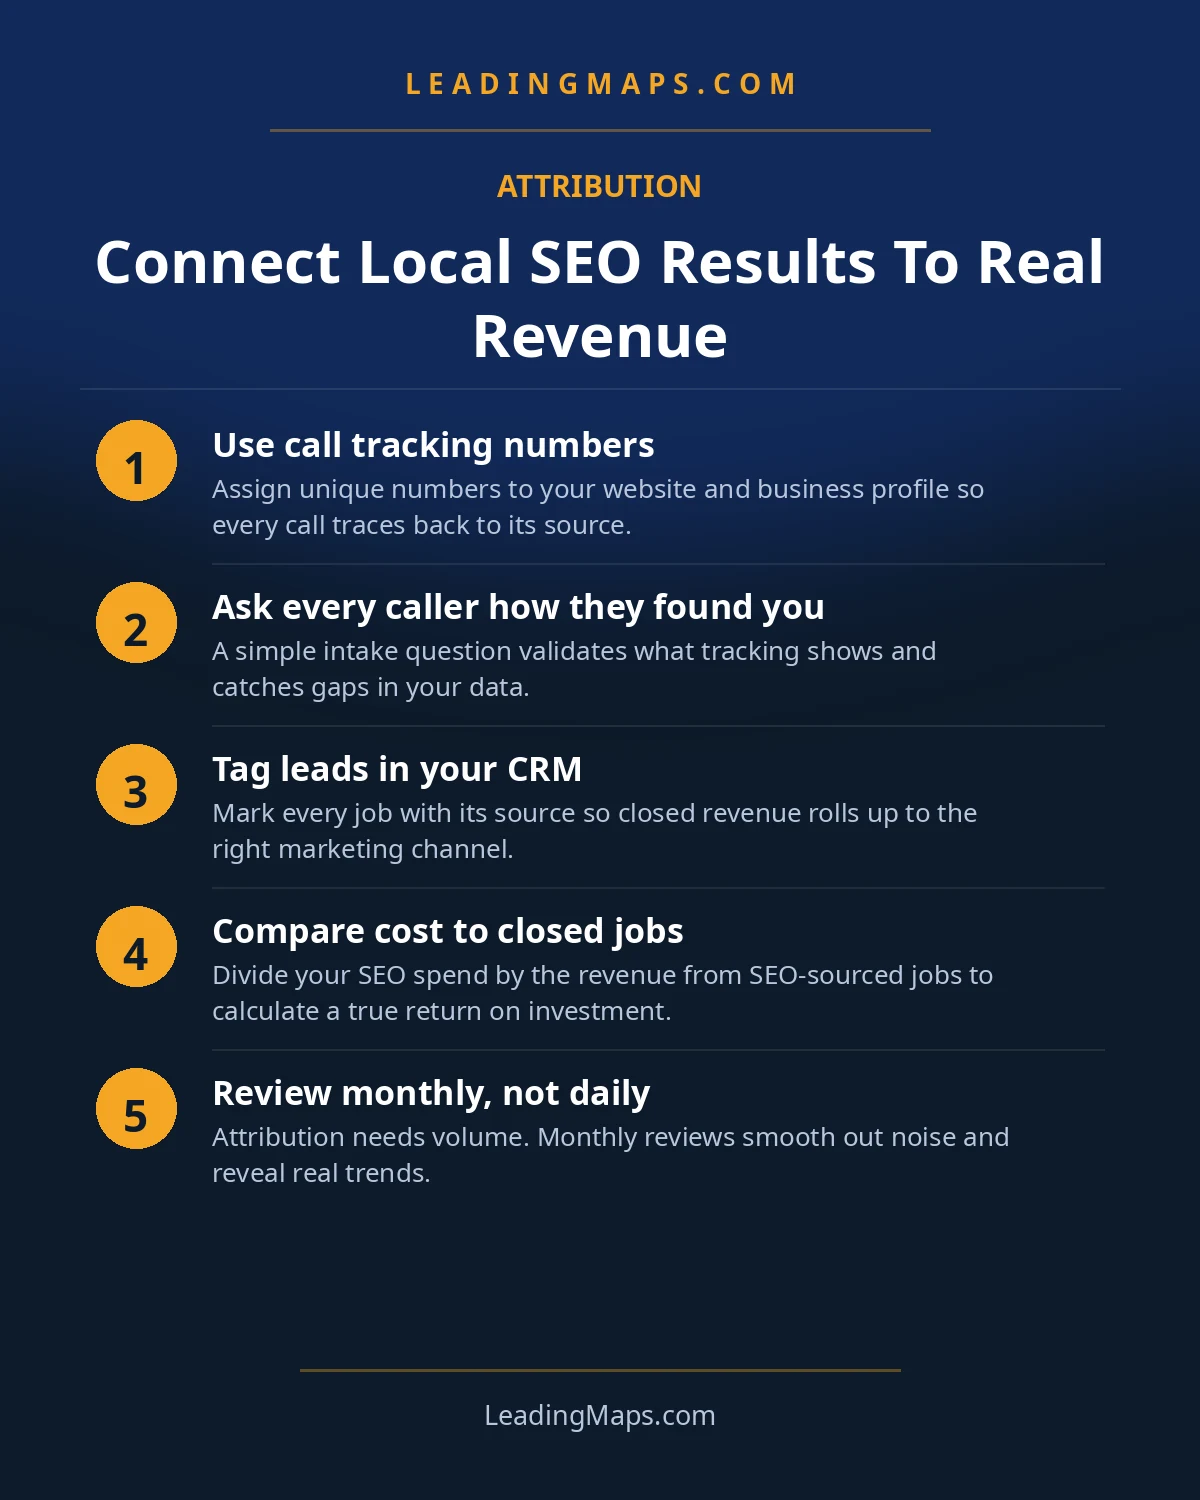
Fix it at the intake. Every call and form gets logged with two fields: source ("How did you hear about us?") and outcome (booked, estimate scheduled, lost, spam). Your close rate is booked jobs divided by qualified leads, and it is a number you already own if you keep even a basic spreadsheet. This one change, tracking outcomes instead of volume, turns every downstream number from decoration into data.
Trade Adjustment 1: Segment Emergency Vs. Planned
Generic attribution uses one "average customer value." For trades, that average is a fiction. A $189 drain cleaning and a $14,000 sewer line replacement are both "a job," and averaging them produces a number that describes neither. Emergency calls close fast at high rates with lower ticket values; planned jobs close slowly at lower rates with much higher values. Run the worksheet as two rows:
- Emergency / dispatch row: high close rate, fast cycle, lower average ticket. Plumbers, HVAC breakdowns, electrical emergencies.
- Planned / estimate row: lower close rate, weeks-long cycle, higher average ticket. Roof replacement, remodels, system installs.
Segmented this way, the worksheet also tells you where to invest. If emergency rows print money and estimate rows do not, that is a sales-process problem, not an SEO problem, and no agency retainer will fix it.
Trade Adjustment 2: Count Repeat Revenue
The first job is rarely the whole story. An HVAC customer on a maintenance plan pays you every year. A drain cleaning customer calls you for the water heater five years later. A roofer's customer refers the neighbor. Generic ROI math counts the first invoice and stops, which systematically undervalues local SEO, because SEO's best customers are the ones who found you once and never search again.
You do not need a perfect lifetime-value model. A simple version works: for each trade, estimate the average customer's three-year value (first job + expected repeat + one referral), and run the worksheet once with first-job revenue and once with three-year value. The truth sits between them, and both numbers are more honest than the single-invoice version.
Our guarantee: top-3 map-pack average within 90 days, month-to-month after that. When the worksheet in this guide shows the numbers moving, you will know exactly what the work bought you, in dollars, not rankings.
Trade Adjustment 3: First-Touch Vs. Last-Touch
The typical trade customer journey crosses channels: they saw you on Maps, then searched your brand name, then called. Last-touch attribution gives all the credit to the branded search and zero to the Maps discovery that made the call possible. First-touch does the reverse. Both are wrong alone, and agencies usually show you whichever one flatters their work.
The practical fix is to look at both and give your Maps presence assist credit. When your intake log says "Google" and the customer's first exposure was the map pack, that revenue belongs partly to Maps even if the final click was branded. The most useful single metric for trades is conversion rate by geography: the towns where you rank and convert vs. the towns where you rank and do not. That view tells you which service areas deserve more effort and which are already saturated.
The AI Line Item
Here is the revenue that is currently invisible in every analytics setup. When a homeowner calls because ChatGPT or Perplexity recommended you, your analytics record it as direct, unknown, or "Google" if they searched your brand name afterward. No dashboard has an AI-referral channel yet, which means AI-driven revenue is $0 in every report, not because it is zero, but because nobody is counting it.
The fix is a human, not a tool. Add "AI assistant" as an option on your intake question, right next to Google, referral, and repeat customer. When the homeowner says ChatGPT sent them, log it like any other source and follow the job through to booked revenue. Review the AI line monthly alongside the rest. In 2026, this is the fastest-growing row in the worksheet for contractors who ask the question, and it is $0 for everyone who does not.
The Worked Example (Hypothetical)
All numbers below are a labeled hypothetical for a two-truck plumbing company, to show the mechanics. Use your own.
Emergency row: 90 calls × 50% qualified = 45 qualified leads × 70% close rate = 31 booked jobs × $650 average ticket = $20,150.
Planned row: 30 estimate requests × 60% qualified = 18 × 40% close rate = 7 booked jobs × $4,200 average ticket = $29,400.
Total attributed revenue: $49,550 on a $1,500 monthly investment.
ROI: ($49,550 − $1,500) ÷ $1,500 = roughly 32x. That is the arithmetic of the trade: one planned-job row can carry the whole worksheet. Now run it with your numbers. If your close rates are guesses, track them for 60 days and rerun. The worksheet gets sharper every month you feed it.
What Is Measured Vs. What Is Estimated
End with intellectual honesty, because attribution done sloppily is worse than none at all. Calls and forms are measured, straight from your tracking number and inbox. Qualification rate is estimated from your intake log, and it is only as good as the person asking the question. Close rate is measured if you keep a spreadsheet, guessed if you do not. Job values are measured from your invoices. Repeat revenue is estimated, and should be labeled as such every time you show the worksheet to anyone.
The point is not perfect attribution. It is attribution you can defend in a room: here is what we spent, here is what we can trace, here is what we estimate, and here is the trend. That is more than most contractors have, and more than most agency reports provide. For the cost side of the equation, our contractor pricing guide keeps the "investment" number honest, and our timeline guide tells you when the revenue row should start moving.
Attribution Questions, Answered.
Subtract your total monthly SEO cost from the revenue your worksheet attributes to local SEO, then divide by that cost. Total cost means everything: retainer, tools, and your own hours valued at your billable rate. Attributed revenue means booked jobs traced to calls and forms, not raw traffic or rankings.
Booked jobs. A call is a chance at revenue; a booked job is revenue. Call counts flatter every report because they include wrong numbers, price shoppers, and jobs outside your service area. Track which calls become estimates and which estimates become jobs, and your attribution stops lying to you.
First-touch credits the channel where the customer discovered you, often Google Maps for trades. Last-touch credits the final click before the call, often a branded Google search. Last-touch steals credit from the discovery that made the call possible. Look at both, and give your Maps presence assist credit instead of judging it on last-touch alone.
Add 'AI assistant' as an option on your intake question, right next to Google, referral, and repeat customer. When a homeowner says ChatGPT sent them, log it like any other source and follow the job through to booked revenue. Those leads are currently invisible in analytics, which is exactly why they need a human asking the question.
Emergency trades often see revenue move within 60 to 90 days, because one after-hours call can be a four-figure job. Planned-job trades take longer, since estimates close weeks later. Ignore anyone else's payback timeline. Run the worksheet in this guide with your numbers, and it will tell you your break-even point, not theirs.
SEO Looks Good On Paper, But What About Revenue?
Calls, rankings, and competitors traced back to booked jobs and dollars, plus whether AI assistants send you revenue nobody is counting. A prioritized action plan, free, no pitch.
- AI visibility check, real homeowner prompts across ChatGPT, Perplexity, and AI Overviews, who gets named.
- Proposal scorecard, what your current or prospective agency should be doing, item by item.
- Competitor gap analysis, what the top 3 in your market are doing that you're not.
Get My Free SEO Audit
Delivered within 48 hours. Yours to keep.